

Solar Panels Nevada — Costs, Savings & Payback
The Real Cost of Waiting for Solar Panels in Nevada
NV Energy increased rates 3–5% annually over the past decade, with a 8% hike this past year. While Nevada's rate of $0.13/kWh is below average, 6.38 daily sun hours make solar panels in Nevada financially viable — generating $990-$1,980 in annual savings for a typical household.
To give you a reliable picture, these estimates are built on strictly conservative assumptions: no expired incentives, includes ~4%/yr electricity rate increases (EIA historical avg), Net Billing without battery storage · ~55% self-consumption assumed. While other sites inflate their numbers to close a sale, we show reality — so the savings you see here are savings you can actually count on.
Nevada Solar Data at a Glance
Solar works in Nevada largely because of the sun resource: 6.38 peak sun hours daily, above the national average. That output level is enough to meaningfully reduce a typical monthly bill, with $41,229 – $82,459 projected over the system's 25-year life.
Source: NSRDB (NLR (formerly NREL))
Most Nevada homeowners going solar in 2026 are looking at a gross investment of $20,800 – $41,600 — with returns outperforming the national average. The payback period is longer than high-rate states, but positive over 25 years. Nevada's property tax exemption shields $15,000 – $25,000 in solar-added home value from reassessment.
Rates from EIA ($0.13/kWh), sun hours from NLR. All figures use real location data and already factor in a 4%/year compounded electricity rate increase — giving you a realistic picture you can actually plan with. Use our free solar calculator for Nevada to get a personalized ZIP-level estimate.
Data: September 2026
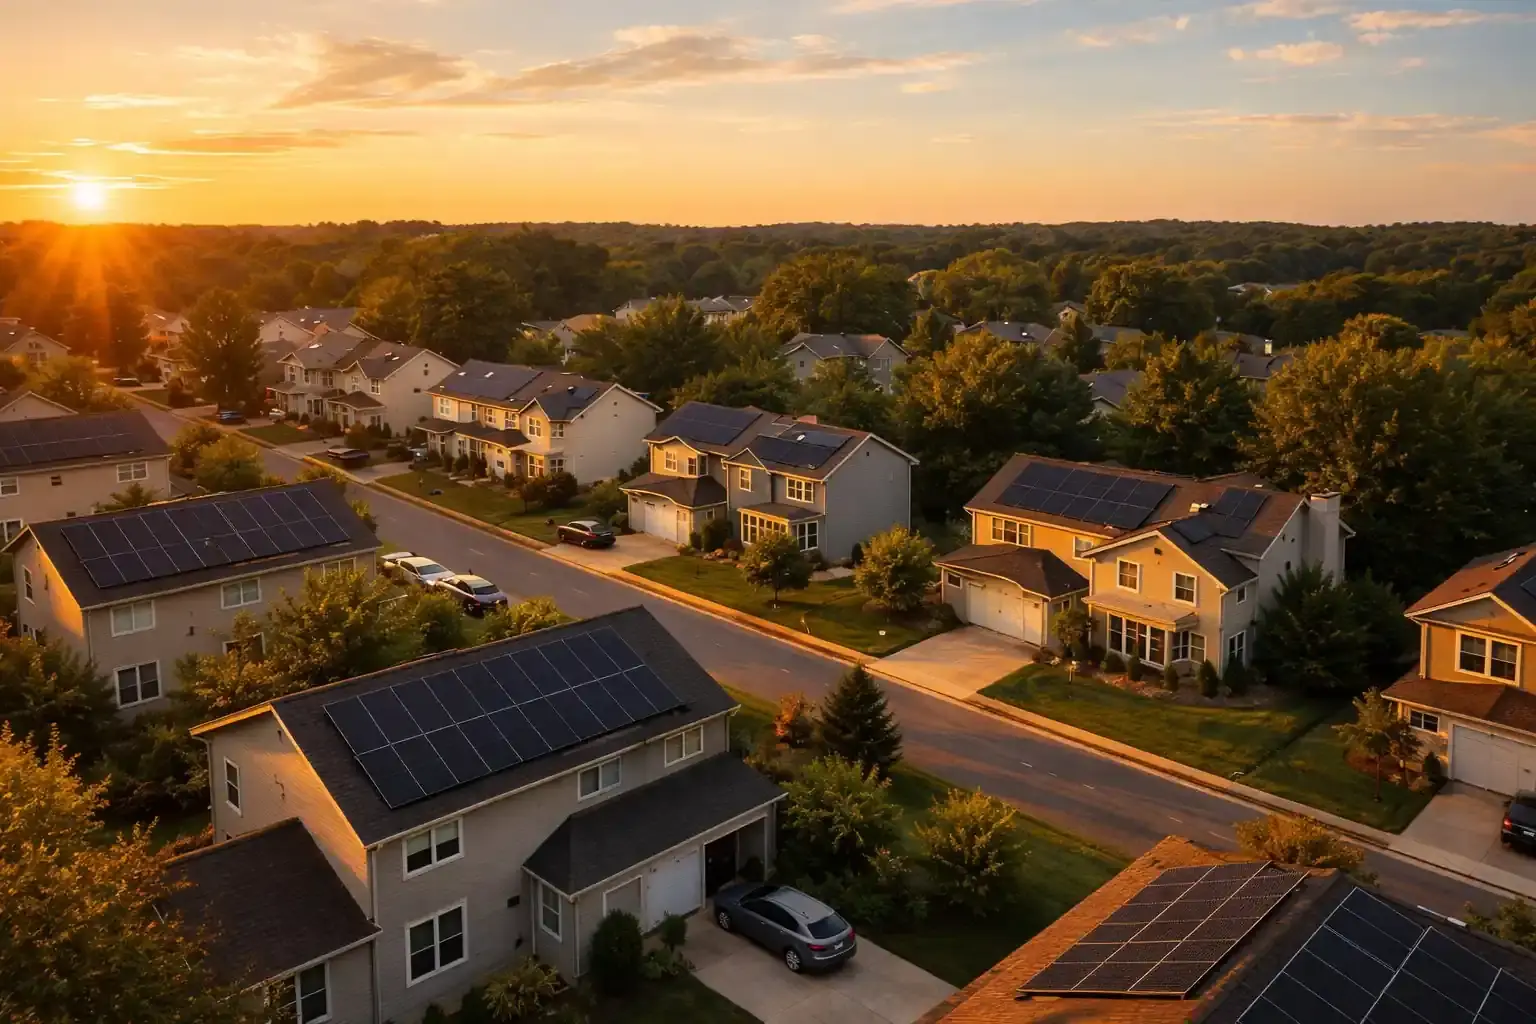
Why Solar Panels in Nevada Make Financial Sense
- At $0.13/kWh, Nevada's rate is below average — but 6.38 daily sun hours and a 3–5%/year rate increase trend still make solar panels in Nevada a sound long-term investment
- 6.38 peak sun hours daily — +42% more than the US average — which directly increases the kilowatt-hours a Nevada system produces per panel
- Nevada exempts solar-added home value from property tax reassessment — your assessed value rises by $15,000 – $25,000 but you pay no additional property tax on that increase
- Even with net billing rather than full retail NEM, pairing solar panels in Nevada with battery storage maximizes self-consumption and maintains strong returns.
Nevada law protects solar-added home value from property tax — your assessed value rises by $15,000 – $25,000 but you pay no additional property tax on that amount. NLR and SEIA data consistently show solar panels in Nevada delivering positive lifetime returns, particularly for NV Energy customers, where rates have climbed 3–5% per year and the shift to net billing makes self-consumption increasingly important. Use our Solar Savings Calculator for your address.
Top Solar Cities in Nevada
| City | Peak Sun Hrs | Avg. Rate | Est. 25-Yr Net Profit* | Est. Payback |
|---|---|---|---|---|
| Las Vegas | 6.41 hrs/day | $0.15/kWh | $31,053 | 14 years |
| Reno | 5.62 hrs/day | $0.15/kWh | $26,893 | 16 years |
| Henderson | 6.41 hrs/day | $0.15/kWh | $31,053 | 14 years |
| Carson City | 5.58 hrs/day | $0.15/kWh | $25,853 | 17 years |
*$200/month bill, south-facing roof. NLR + EIA data. Use our free Solar Savings Calculator for your exact address.
Solar Panels Nevada vs. US Average
| Factor | NV | US Average | NV Advantage |
|---|---|---|---|
| Peak Sun Hours | 6.38 hrs/day | 4.5 hrs/day | +42% more |
| Solar Payback Period | ~16 years | 10 years (US avg) | 6 yrs slower |
| 25-Yr Net Profit* | $26,893 | $71,870 | $44,977 less |
| 25-Year ROI* | ~96% | ~256% (US avg) | -160% lower |
*$200/month bill reference. Sources: NSRDB (NLR), EIA.
While Nevada's rate of $0.13/kWh is below the national average, 6.38 daily sun hours and a 3–5%/year rate increase trend make solar panels in Nevada a worthwhile long-term investment compared to other lower-rate states.

How Much Can a Nevada Family Save with Solar?
Most Nevada families save $990-$1,980 per year with solar panels. Homes with heavy AC loads or EV charging capture peak solar output during Nevada's hottest midday hours — self-consumption is the primary value driver under NV Energy's current export rate structure.
Solar Incentives in Nevada (2026)
Property Tax Exemption: Nevada law prevents solar installations from triggering property tax reassessment. NV Energy customers see home value rise after going solar, with the annual tax bill unaffected.
Net Metering: In Nevada, the export credit rate is below retail — the system assumes 55% self-consumption. Adding battery storage increases self-consumption from ~55% to ~85% — potentially +$396/year (~$9,900 over 25 years). See the Battery Sizing Calculator.Next Steps: Going Solar in Nevada
- 1→Calculate your savings Use our Solar Savings Calculator to estimate your exact system size, cost, and payback for your Nevada ZIP code.
- 2→Learn the basics New to solar? Our Solar Basics guide covers how panels work, sizing, and what to expect before you get quotes.
- 3→Check your incentives Review the property-tax, sales-tax, and net-metering programs available in Nevada in our Solar Incentives guide.
- 4→Get dealer & installer quotes Compare pricing, financing terms, and whether the installer is registered for any Nevada rebate program before you sign.
Nevada Solar FAQ
Yes, but sizing matters. With a below-retail export rate, the return depends on how much of your own power you actually use. Typical payback is ~16 years.
Most homeowners save $990-$1,980 a year at $0.13/kWh and 6.38 peak sun hours — $41,229 – $82,459 over 25 years. Run your ZIP through our Solar Savings Calculator.
A typical Nevada home needs 8–16 kW (20–40 panels), costing $20,800–$41,600.
Net metering here is Net Billing (Reduced) — exports earn a below-retail rate, so battery storage adds the most value.
Often worth it. Nevada pays a below-retail rate for exported power, so storing it for your own use recovers value you would otherwise give away.
The federal tax credit (Section 25D) expired December 31, 2025. Net metering: Net billing (below-retail export rate) — self-consumption is the primary value driver. Full list: DSIRE.
Solar in Nearby States
Electricity rates and sun hours vary by region — see how solar compares in neighboring states: Arizona, California, Idaho, Oregon, and Utah.
Curious how solar looks elsewhere? Check out Solar Panels by State →
Free Tools & Guides
Nevada solar data sourced from U.S. EIA, NLR, and DSIRE. Last updated September 2026. Estimates are illustrative averages — use our free Solar Savings Calculator for personalized results.